Division chart (1–12)
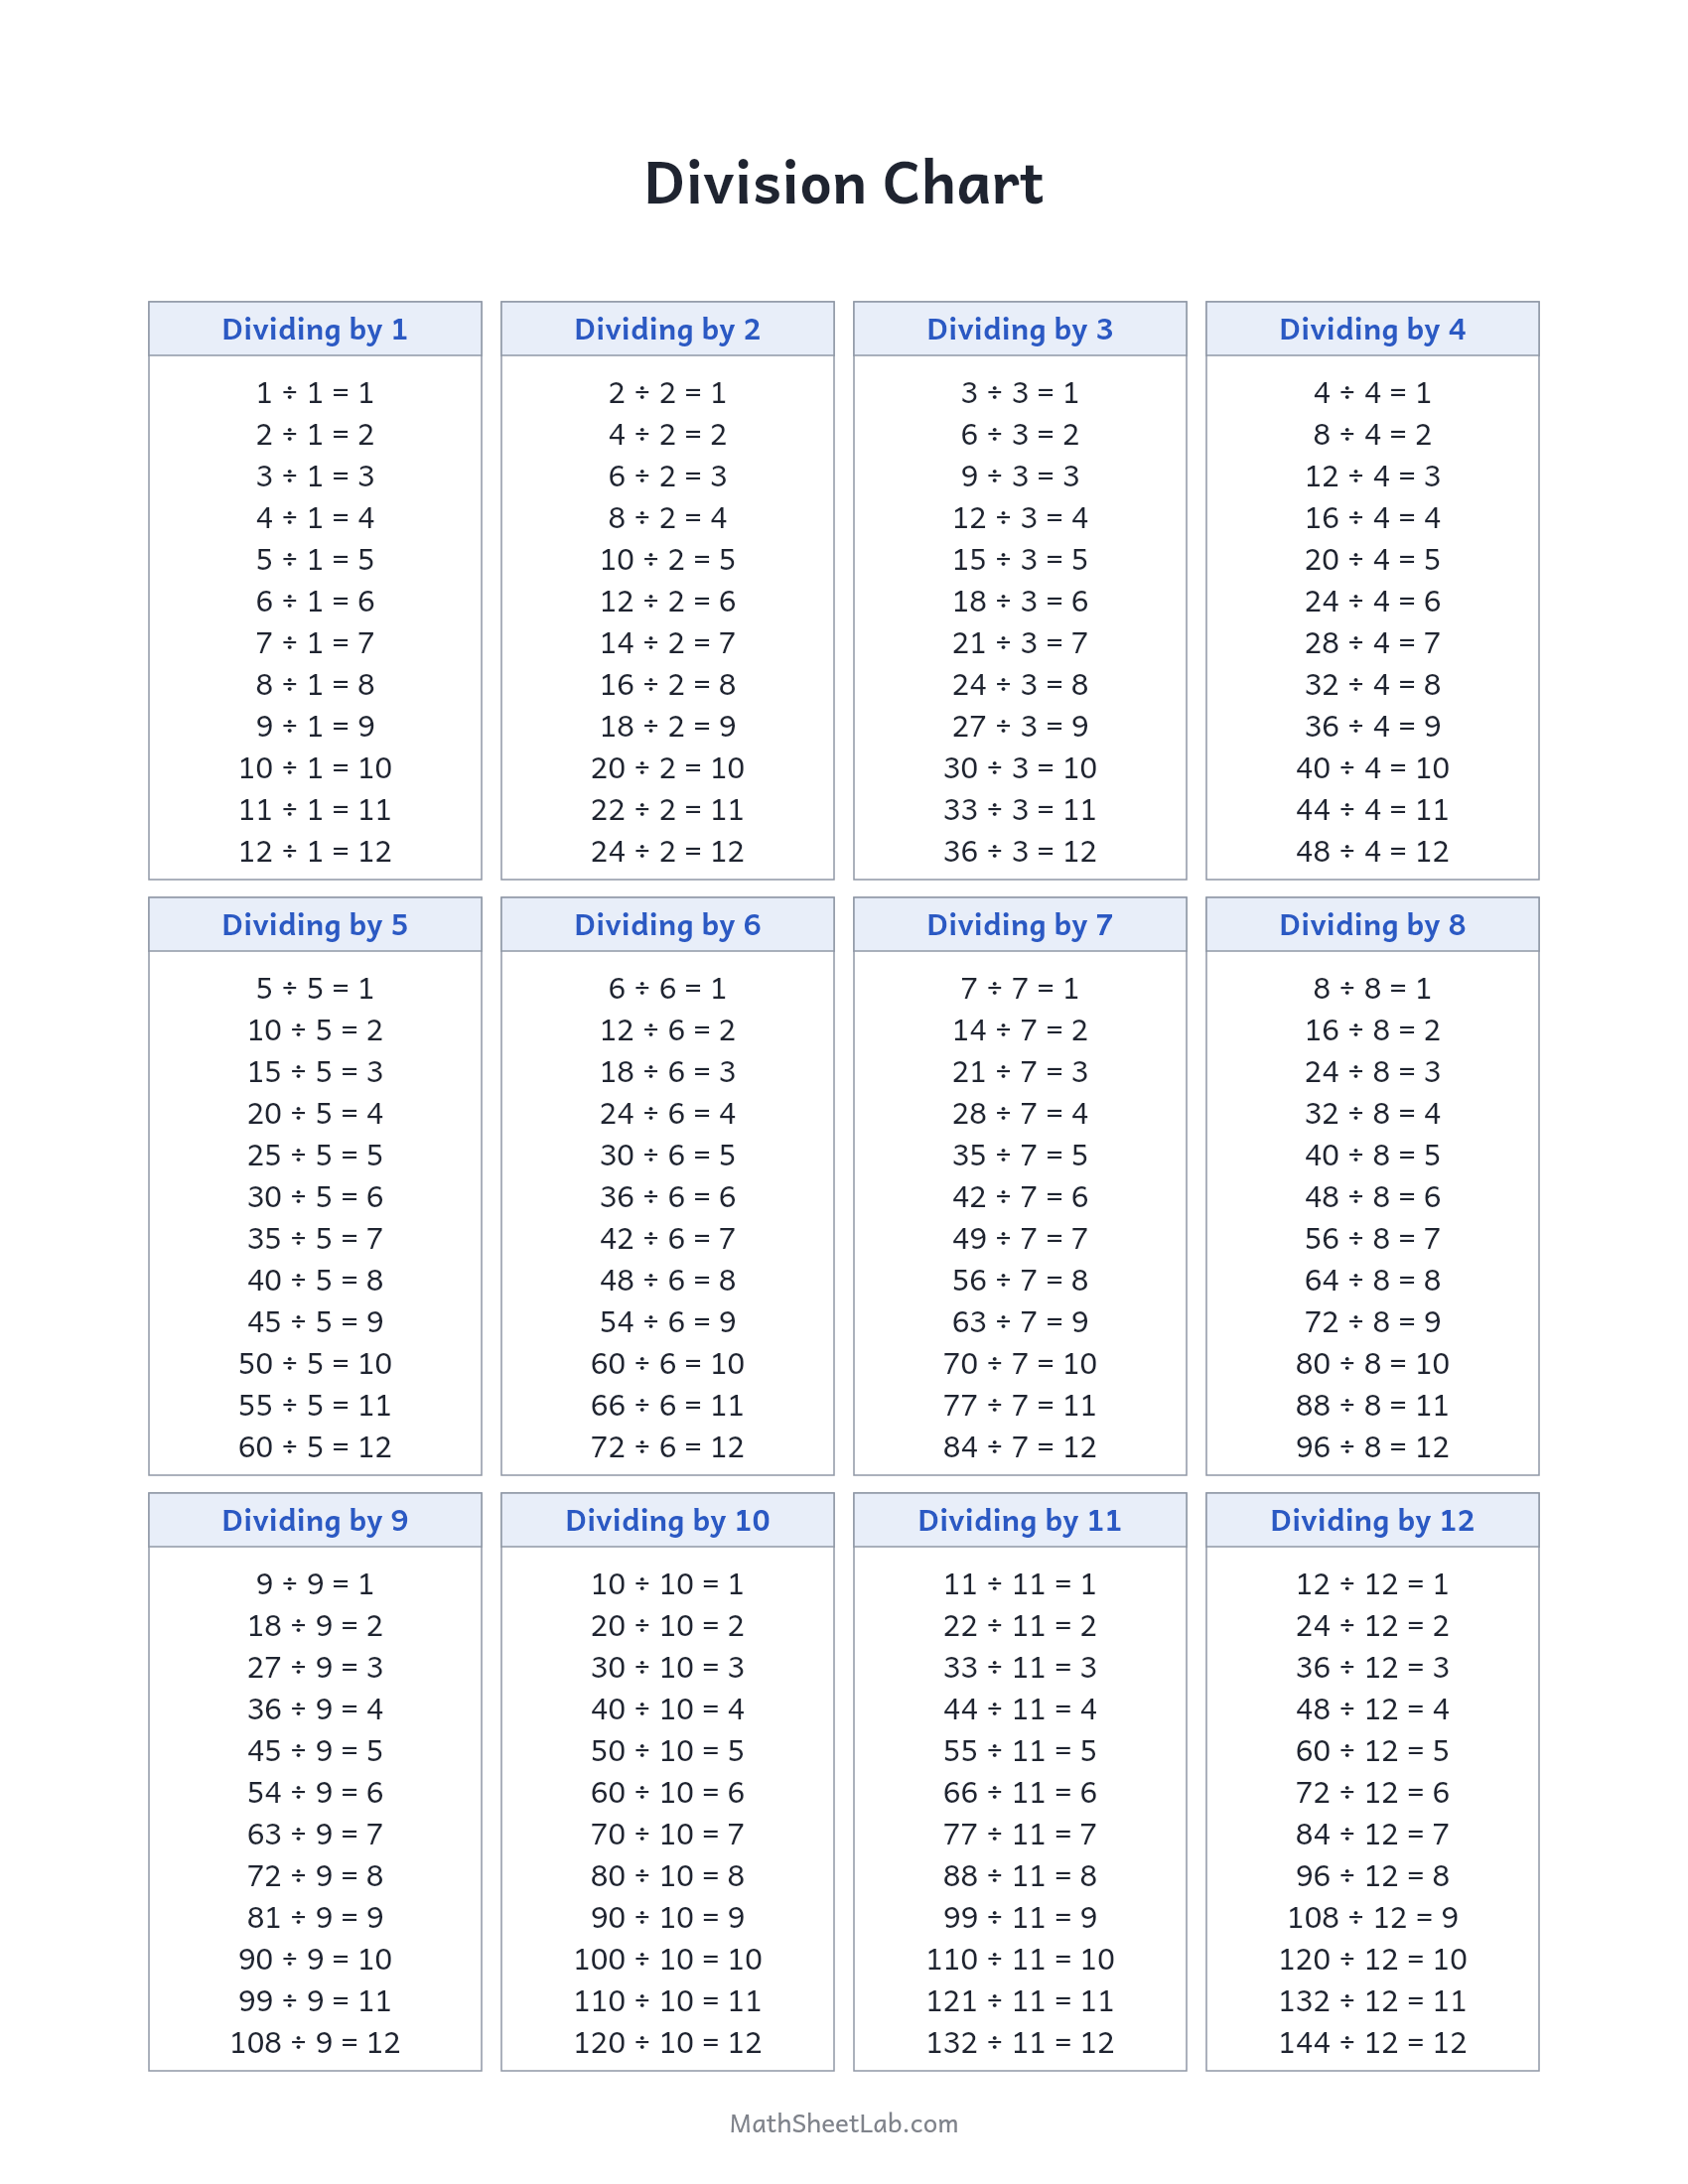
Every division fact with divisors 1–12 written out in full — the division tables, one panel each.
How to print it
- Open the print view. Press Print for a clean print-ready view, or download the PDF or PNG below the chart.
- Fit to page. In the print dialog choose “Fit to page” — the chart is laid out for US Letter and scales cleanly onto A4.
- Copy freely. Print or photocopy as many as you need for home, classroom or tutoring use. It is free, with no sign-up.
About the division chart
Division facts are just multiplication facts read backwards, but seeing them written as division — 56 ÷ 7 = 8 — is what makes that connection click. This chart writes out the full division table for every divisor from 1 to 12, twelve facts per panel. Use it alongside the multiplication chart: cover one, answer from the other, and fact families take care of themselves.
Frequently asked questions
How is this different from a multiplication chart?
Same facts, opposite direction. The multiplication chart shows 7×8 = 56; this chart shows 56 ÷ 7 = 8 and 56 ÷ 8 = 7 written out explicitly, which is how division is first taught.
What grade uses a division chart?
Typically 3rd and 4th grade, when division facts and the multiplication–division relationship are the core of the curriculum.
Does it cover remainders?
No — these are the exact division facts. For remainder practice, generate division worksheets and work beyond the facts.