How to use a multiplication chart
Updated 2026-07-08 · MathSheetLab guides
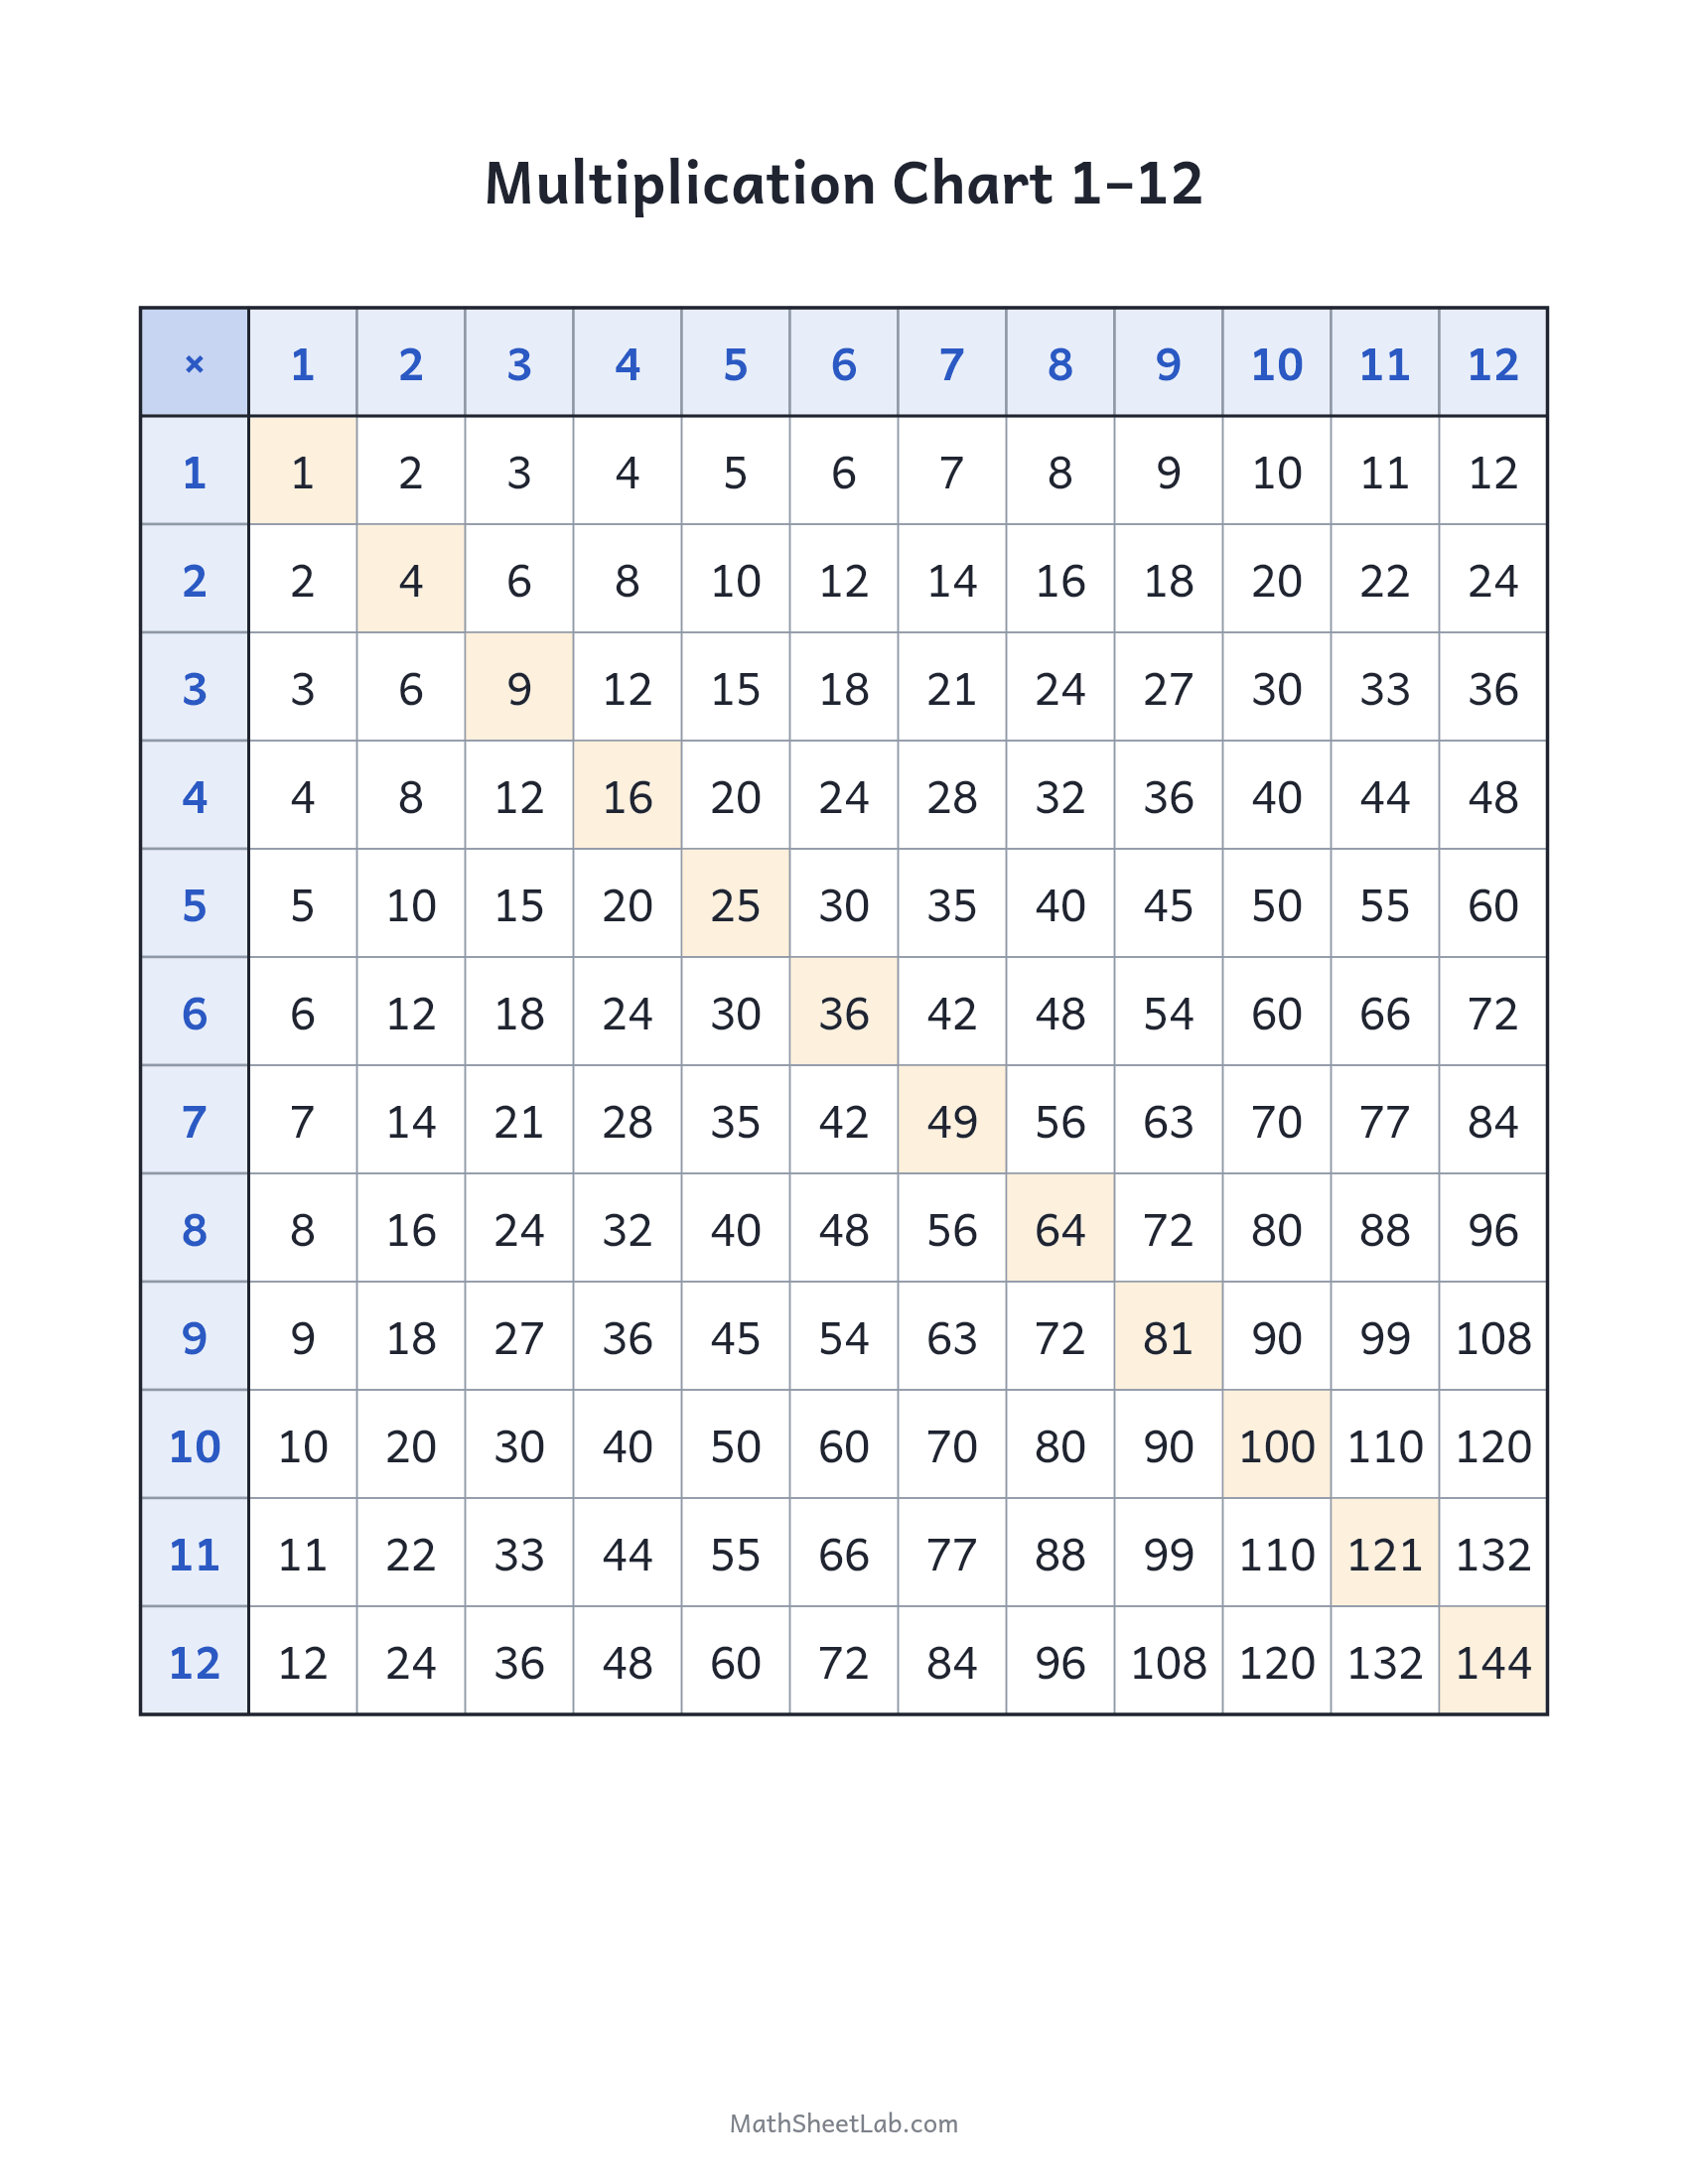
Reading the chart
Pick the first factor in the left column and the second factor in the top row, then slide across and down: the product sits where row and column meet. For 6×7, row 6 meets column 7 at 42. That’s the whole mechanic — a multiplication chart is a lookup table, and even five-year-olds can drive one after two demonstrations.
The two patterns worth pointing out
First, the shaded diagonal of square numbers (1, 4, 9, 16 …) — the chart mirrors itself across it. Cover the top-right half and nothing is lost: 3×8 and 8×3 are the same cell twice. Realising this halves the memorisation job, and it’s worth making the point explicitly.
Second, every row is skip counting. Row 5 reads 5, 10, 15, 20 — the fives count. A child who can skip count already "knows" most of each row; the chart just shows them they know it.
From chart to memory: the fade-out
The chart is scaffolding, not the destination. A routine that works: weeks one and two, full chart available during practice. Weeks three and four, swap in a blank chart the student fills from memory before using it. After that, the chart lives in the desk, consulted only after an honest attempt. The blank-chart fill-in is the checkpoint — when it takes under five minutes with no errors, the facts are functionally memorised.
Which chart size to print
Start with the 1–12 chart — it matches what schools expect. The 1–15 and 1–20 versions suit older students doing bigger mental products, and the 30×30 is a reference poster more than a learning tool. For fluency work, the blank chart is the one that earns its keep.