Place value chart
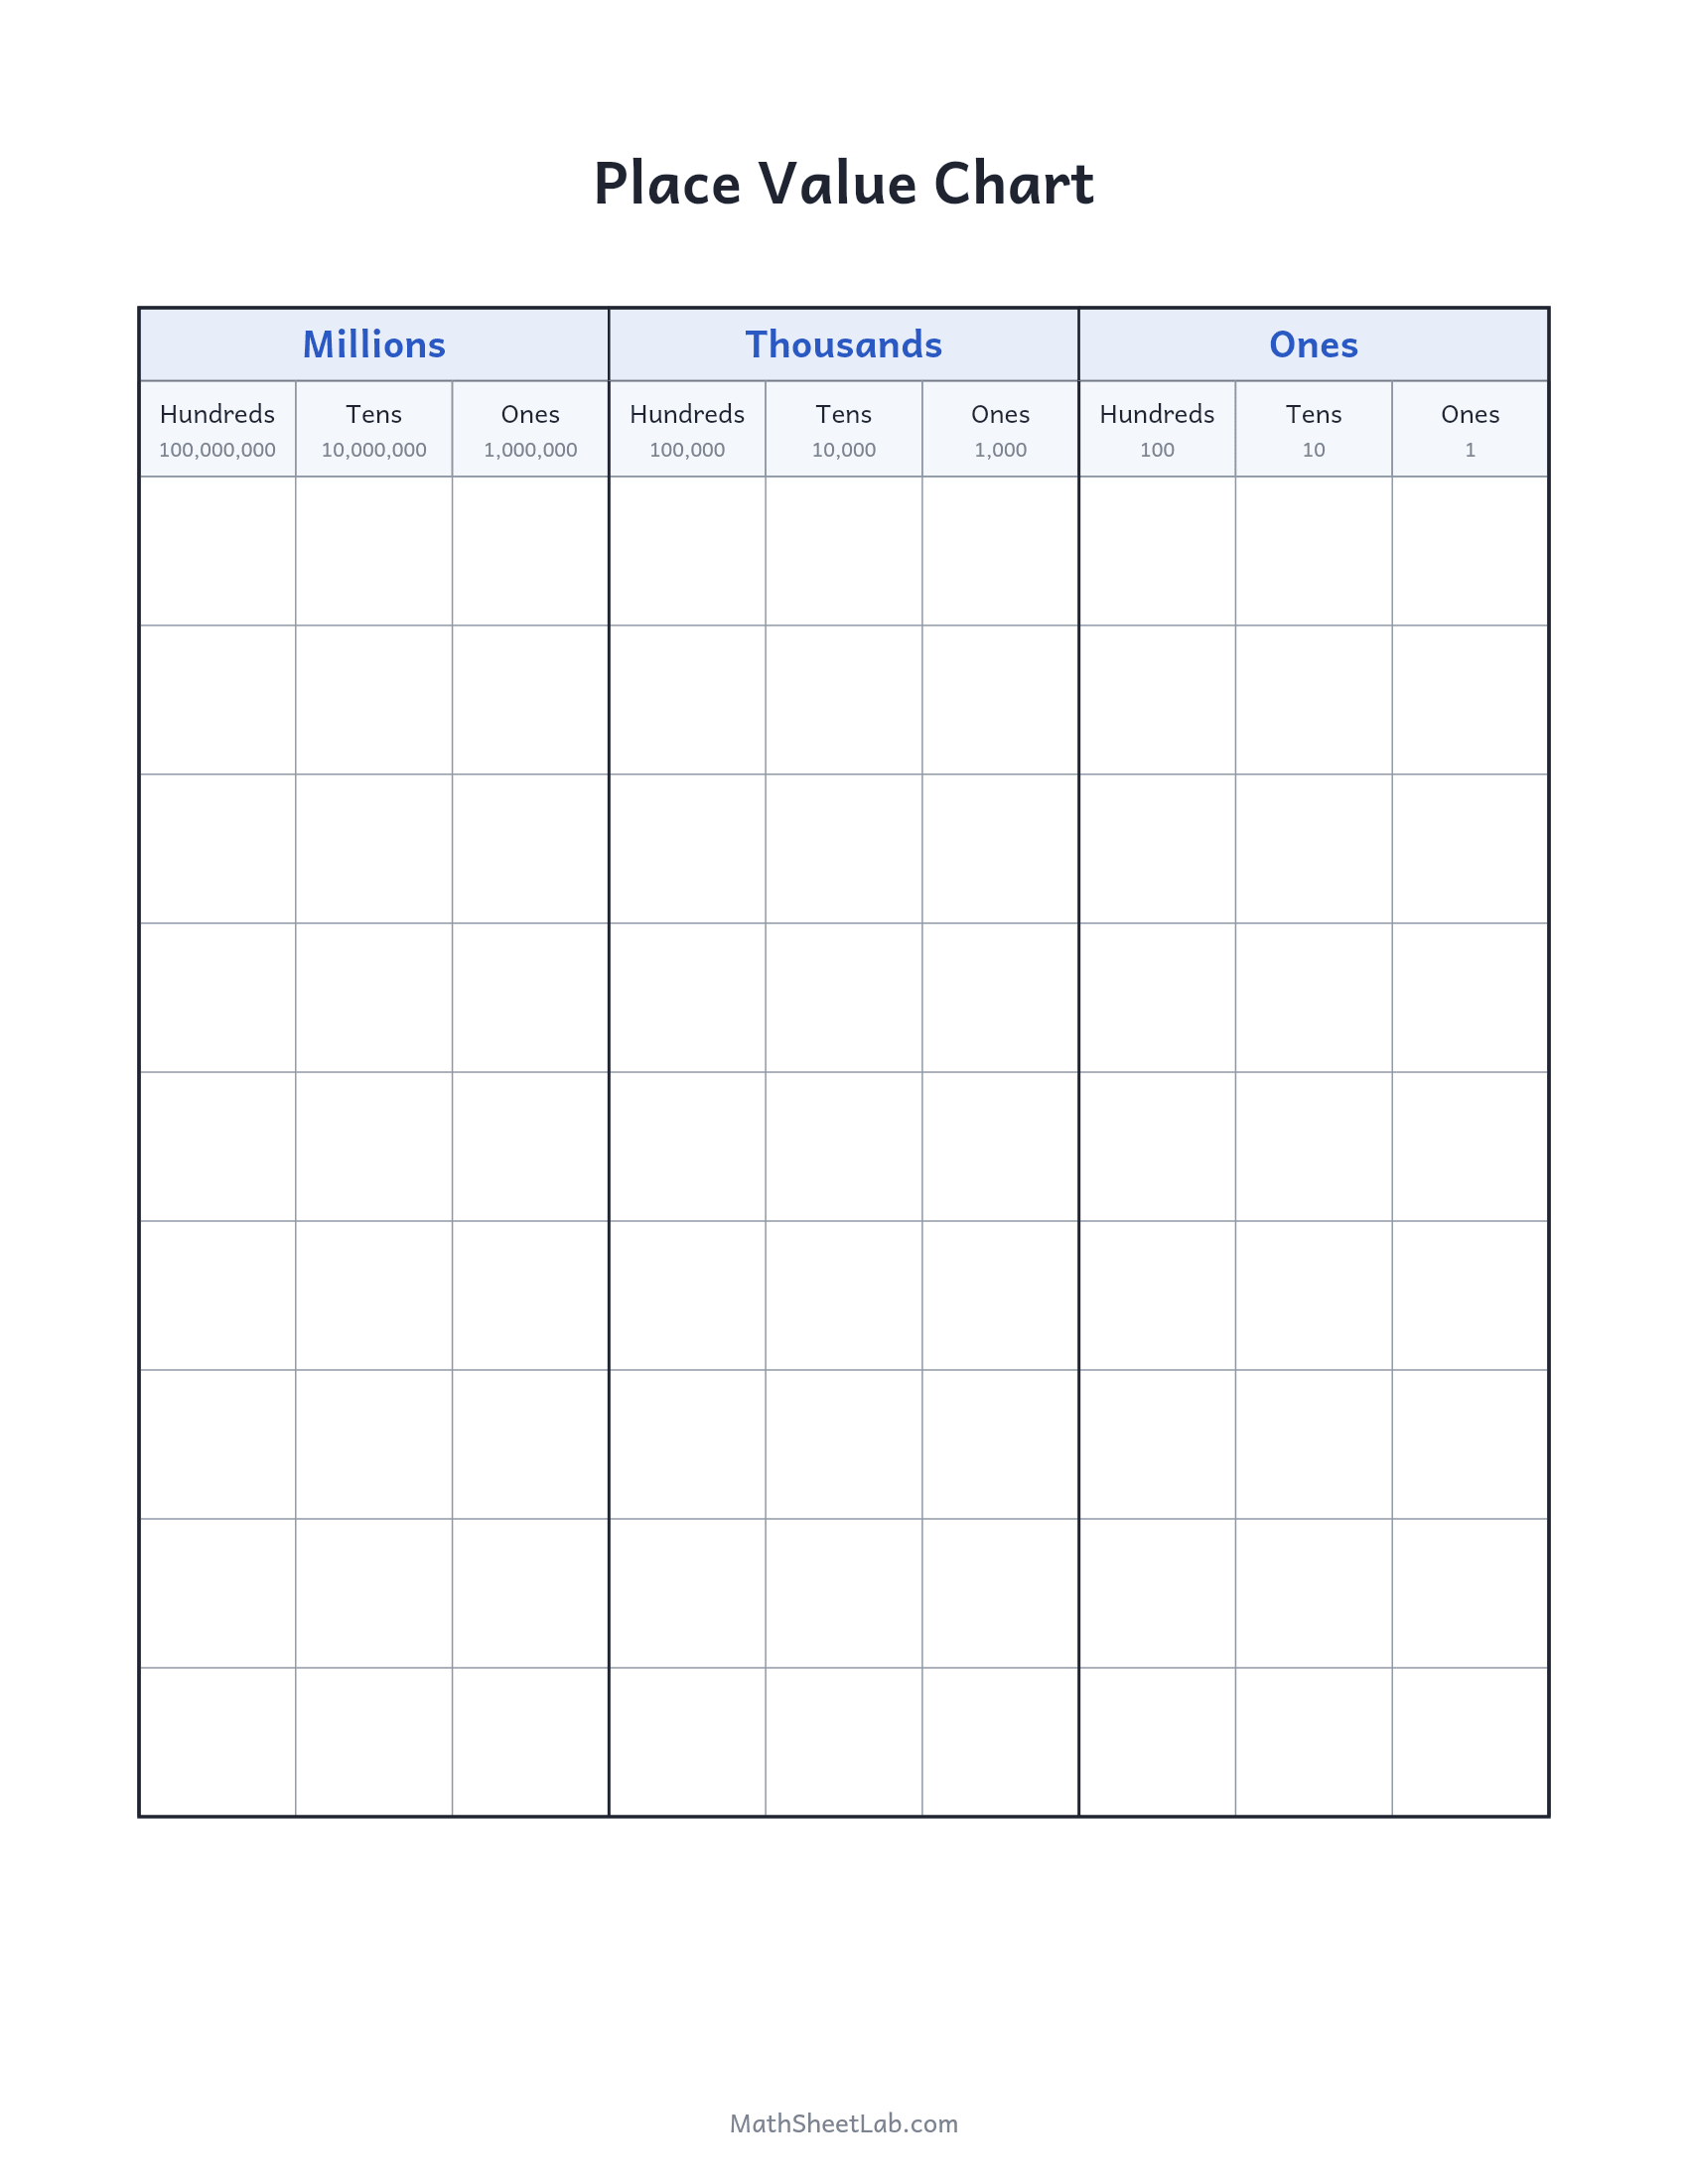
A write-in place value chart from ones to hundred-millions — periods on top, columns beneath, and rows to build numbers in.
How to print it
- Open the print view. Press Print for a clean print-ready view, or download the PDF or PNG below the chart.
- Fit to page. In the print dialog choose “Fit to page” — the chart is laid out for US Letter and scales cleanly onto A4.
- Copy freely. Print or photocopy as many as you need for home, classroom or tutoring use. It is free, with no sign-up.
About the place value chart
Place value is the idea that where a digit sits decides what it is worth — and a chart makes that literal. This one shows the three whole-number periods (ones, thousands, millions), each split into hundreds, tens and ones, with the value of every column printed under its label. The ruled rows are for writing numbers into: dictate "three hundred four thousand, twenty" and the empty hundreds and hundreds-of-thousands columns force the zeros into the right places — the exact skill kids find hardest.
Frequently asked questions
How do you use a place value chart?
Write one digit per column. Reading a number aloud and having students place its digits — especially the zeros — is the classic exercise this chart is built for.
What are the "periods" on the chart?
The three-digit groups separated by commas when we write big numbers: ones, thousands and millions. Each period repeats the same hundreds-tens-ones pattern.
Does it cover decimals?
This chart covers whole numbers to hundred-millions. A decimals version (tenths, hundredths, thousandths) is on the roadmap — the guides explain decimal place value in the meantime.