Multiplication chart vs times table: which to use
Updated 2026-07-08 · MathSheetLab guides
Two formats, two jobs
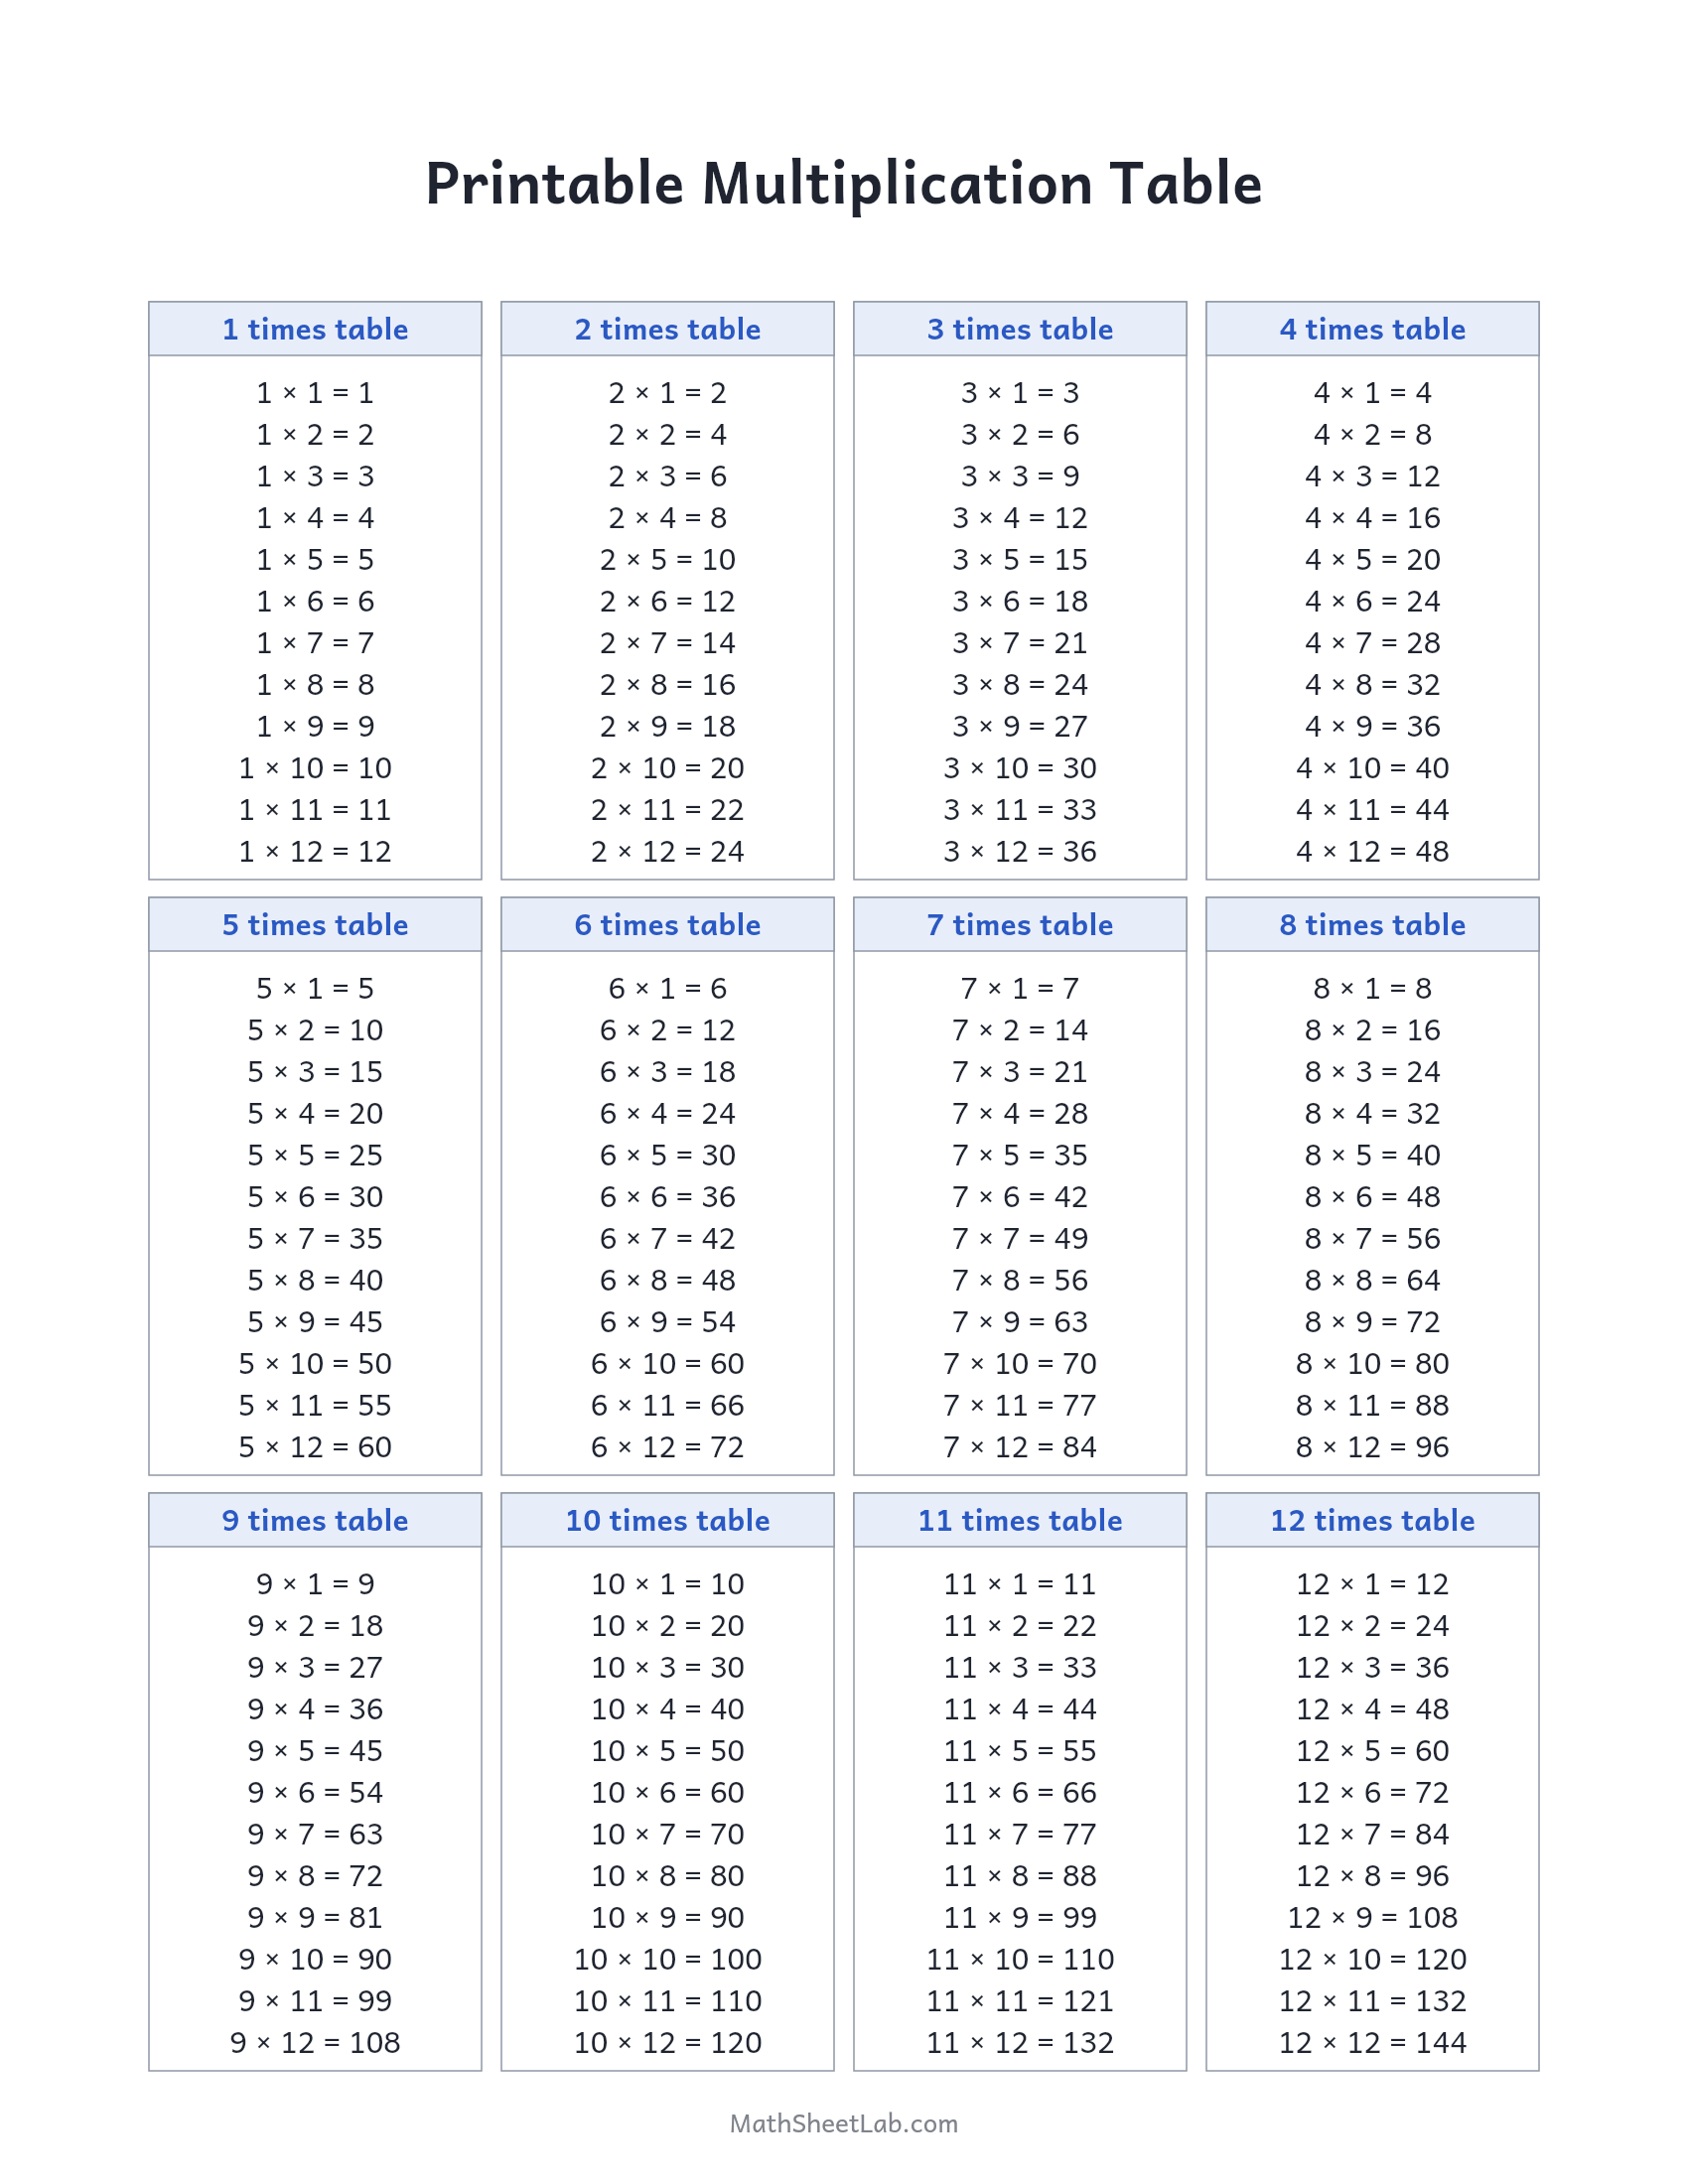
A multiplication chart is the grid — factors on the edges, products in the middle, all 144 facts visible at once. A times table is the list — 7×1 = 7, 7×2 = 14, one table written out line by line. The grid is built for lookup and pattern-spotting; the list is built for reciting and memorising. Neither replaces the other, which is why classrooms use both.
When the list wins
Memorisation is sequential. Chanting a table out loud, in order, attaches rhythm to the facts — and rhythm is memory glue. The written-out tables sheet is for exactly this: one table a week, recited daily, mastered in order.
When the grid wins
Application is random-access. Mid-problem, a child doesn’t need the sevens in order — they need 7×8 right now. The grid answers point questions fast and, unlike the list, shows the deep structure: symmetry across the diagonal, skip counts in the rows, squares down the middle.
A simple rule
Learning the facts? Recite from the table, test on the blank chart. Using the facts in harder work? Keep the grid chart within reach until it goes quiet on its own — nobody consults a chart for facts they already know.