What is a hundreds chart?
Updated 2026-07-08 · MathSheetLab guides
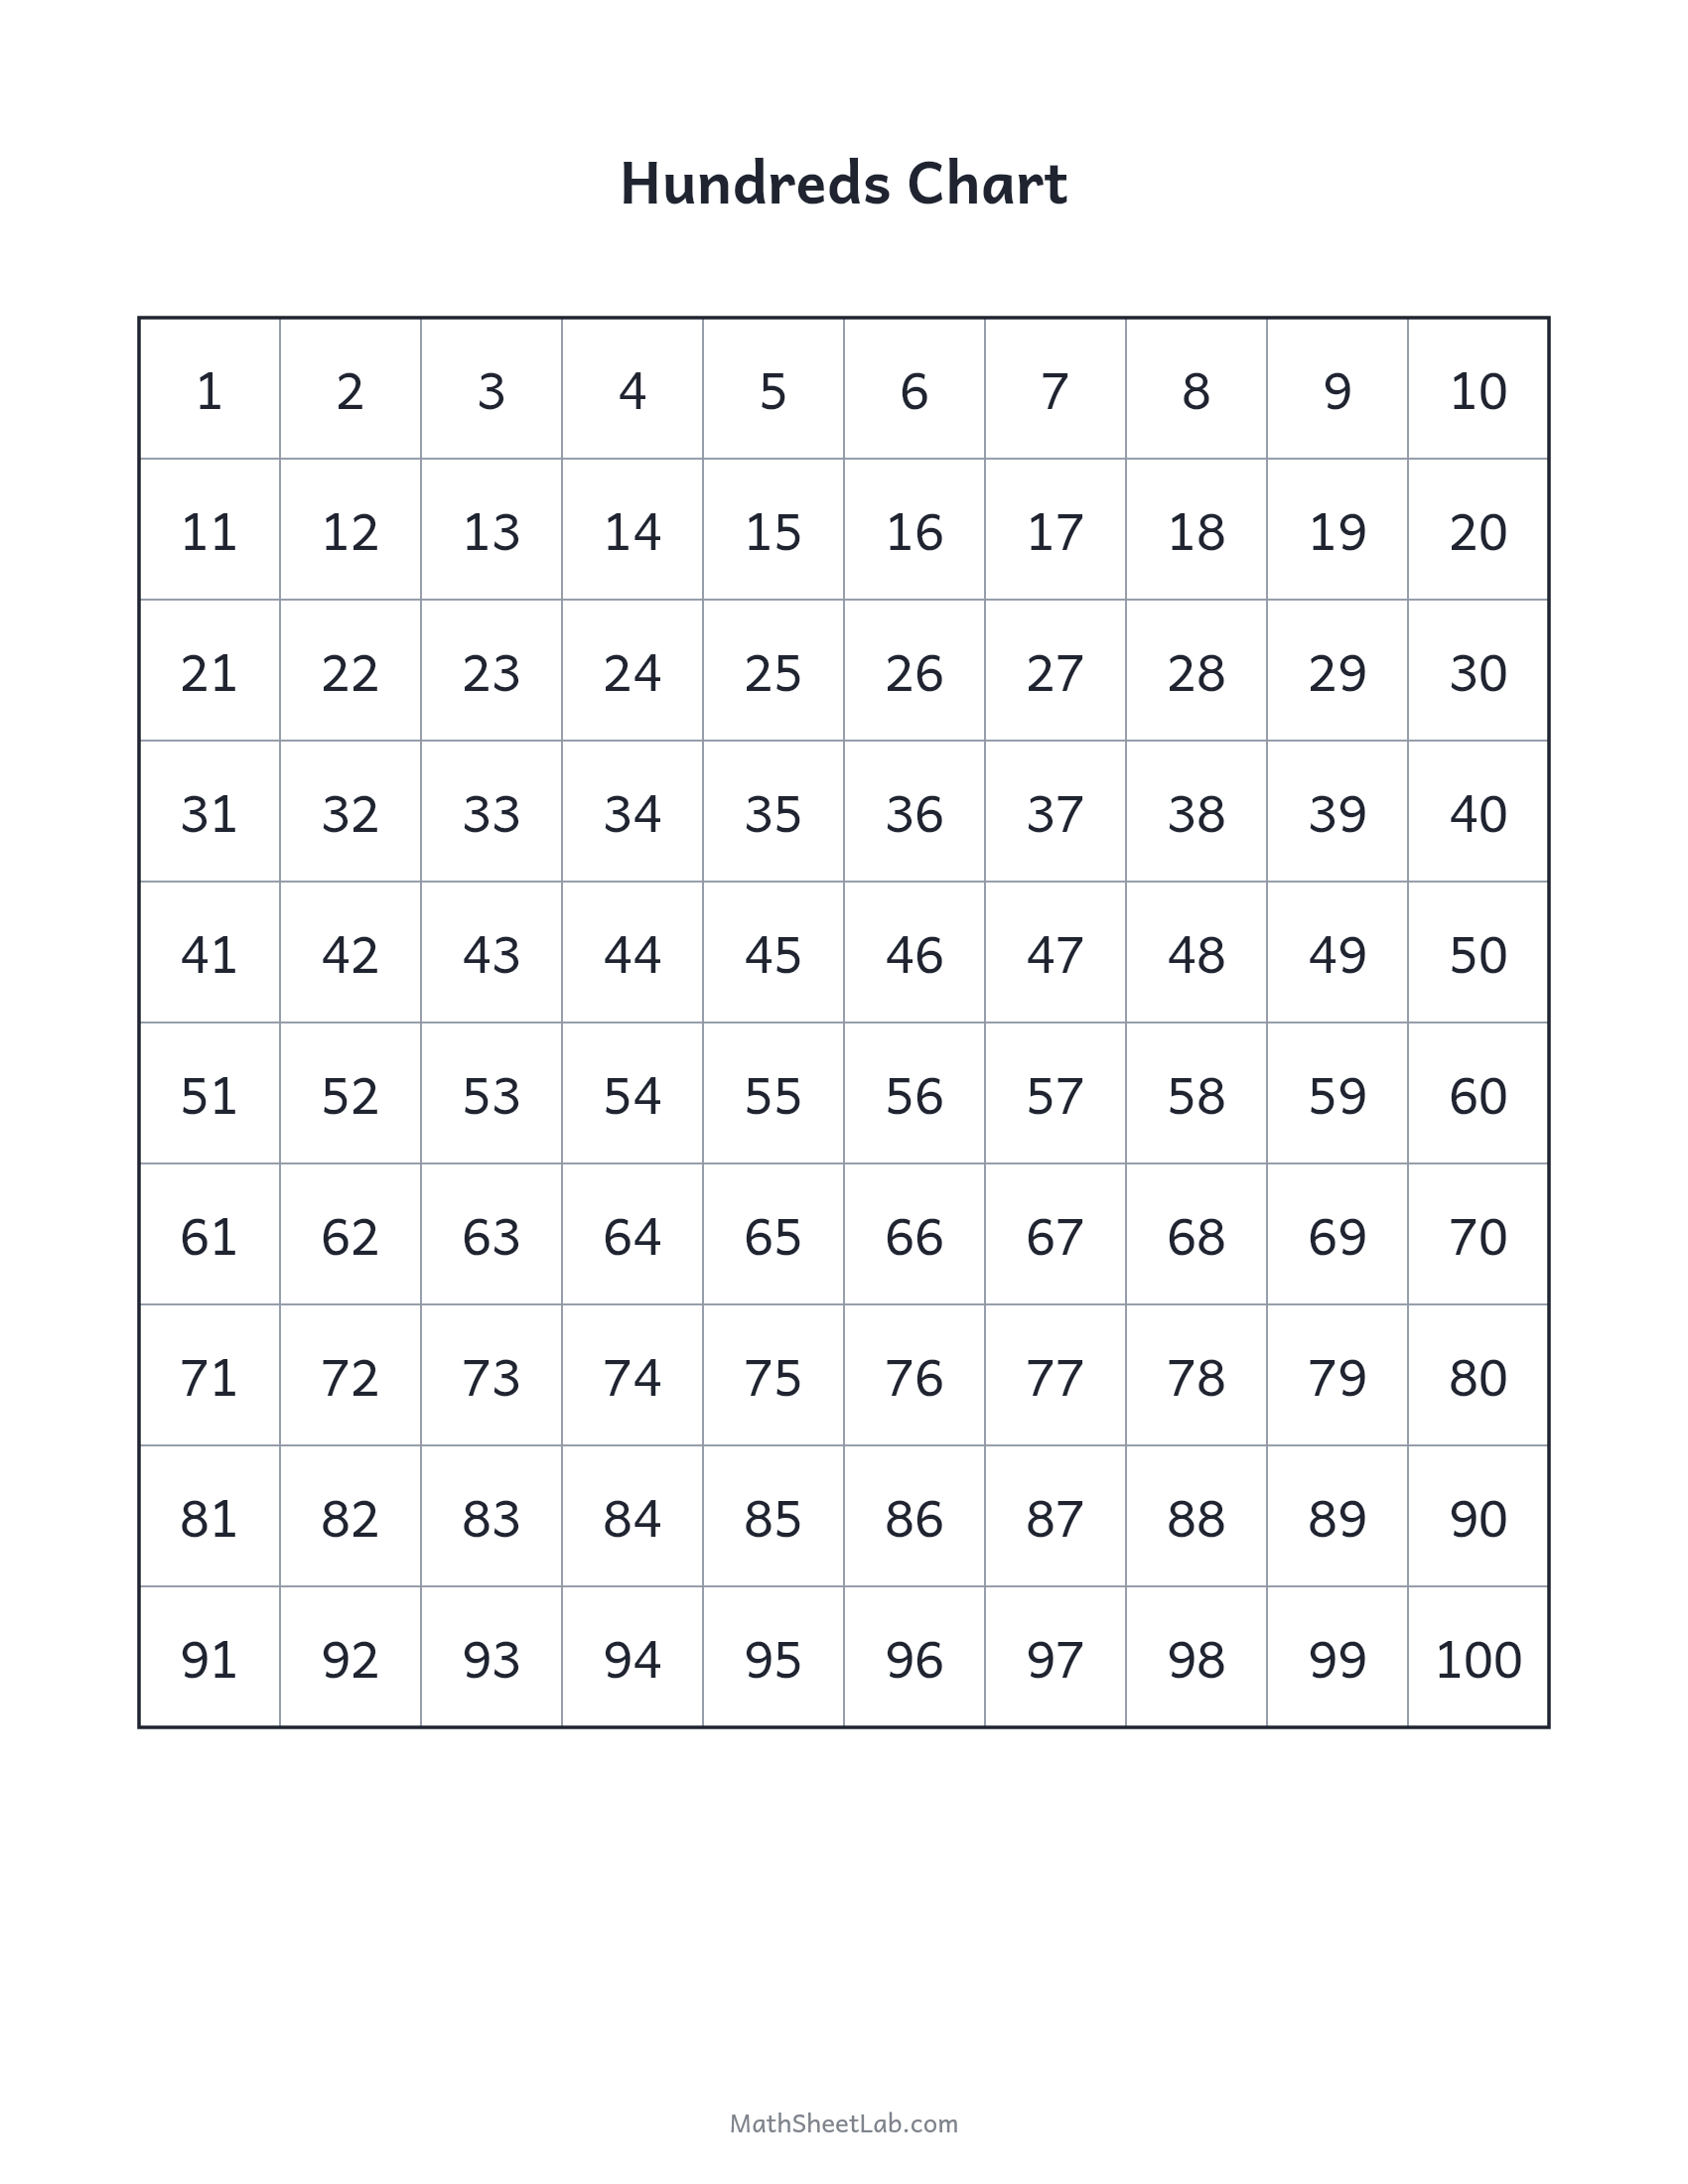
The idea
A hundreds chart is the numbers 1–100 arranged ten to a row. That layout is the entire magic: rows count by ones, columns count by tens, so the structure of two-digit numbers — tens and ones — is baked into the geography. 47 lives in the row of forties, in the sevens column. Once a child can find any number quickly, they’ve internalised more place value than a week of worksheets delivers.
The one insight to teach
Right means plus one; down means plus ten. Ask "what’s ten more than 34?" and let them discover it’s the cell directly below — no counting, just a hop. This is the bridge from counting to mental arithmetic, and it’s why the chart appears in every K–2 classroom on earth.
Activities that earn their time
Number hunts: "find 62" against a timer. Skip-count colouring: shade every 5th cell and name the pattern that appears. Missing-number puzzles: cover a cell with a counter, ask what’s hidden and how they know. Neighbour puzzles on the blank chart: write 45 in an empty grid, then fill the eight cells around it. Each of these is five minutes, no prep beyond printing.
Hundreds chart or 120 chart?
If the child is in 1st grade, print the 120 chart — US standards run counting to 120 precisely because crossing 100 is where the wheels wobble. The hundreds chart remains the classic for kindergarten and for place-value work in 2nd grade.